google-site-verification: google003265b8e9c3c757.html
Idaho Real Estate Market UpdateReal Estate NewsSun Valley Real Estate News August 16, 2023

Idaho Real Estate Market Update

The following analysis of select counties of the Idaho real estate market is provided by Windermere Real Estate Chief Economist Matthew Gardner. I hope that this information may assist you with making better-informed real estate decisions.

https://conta.cc/3OHI9fQ

Q2 2023 Idaho Real Estate Market Update

Idaho Home Sales

❱ In the second quarter of 2023, 5,069 homes sold, which was down 16.1% from the second quarter of 2022. Sales were up 20.8% from the first quarter of this year.

❱ Listing activity was marginally higher than in the second quarter of 2022, but jumped 24.6% from the first quarter of this year, which caused the pace of sales to rise significantly.

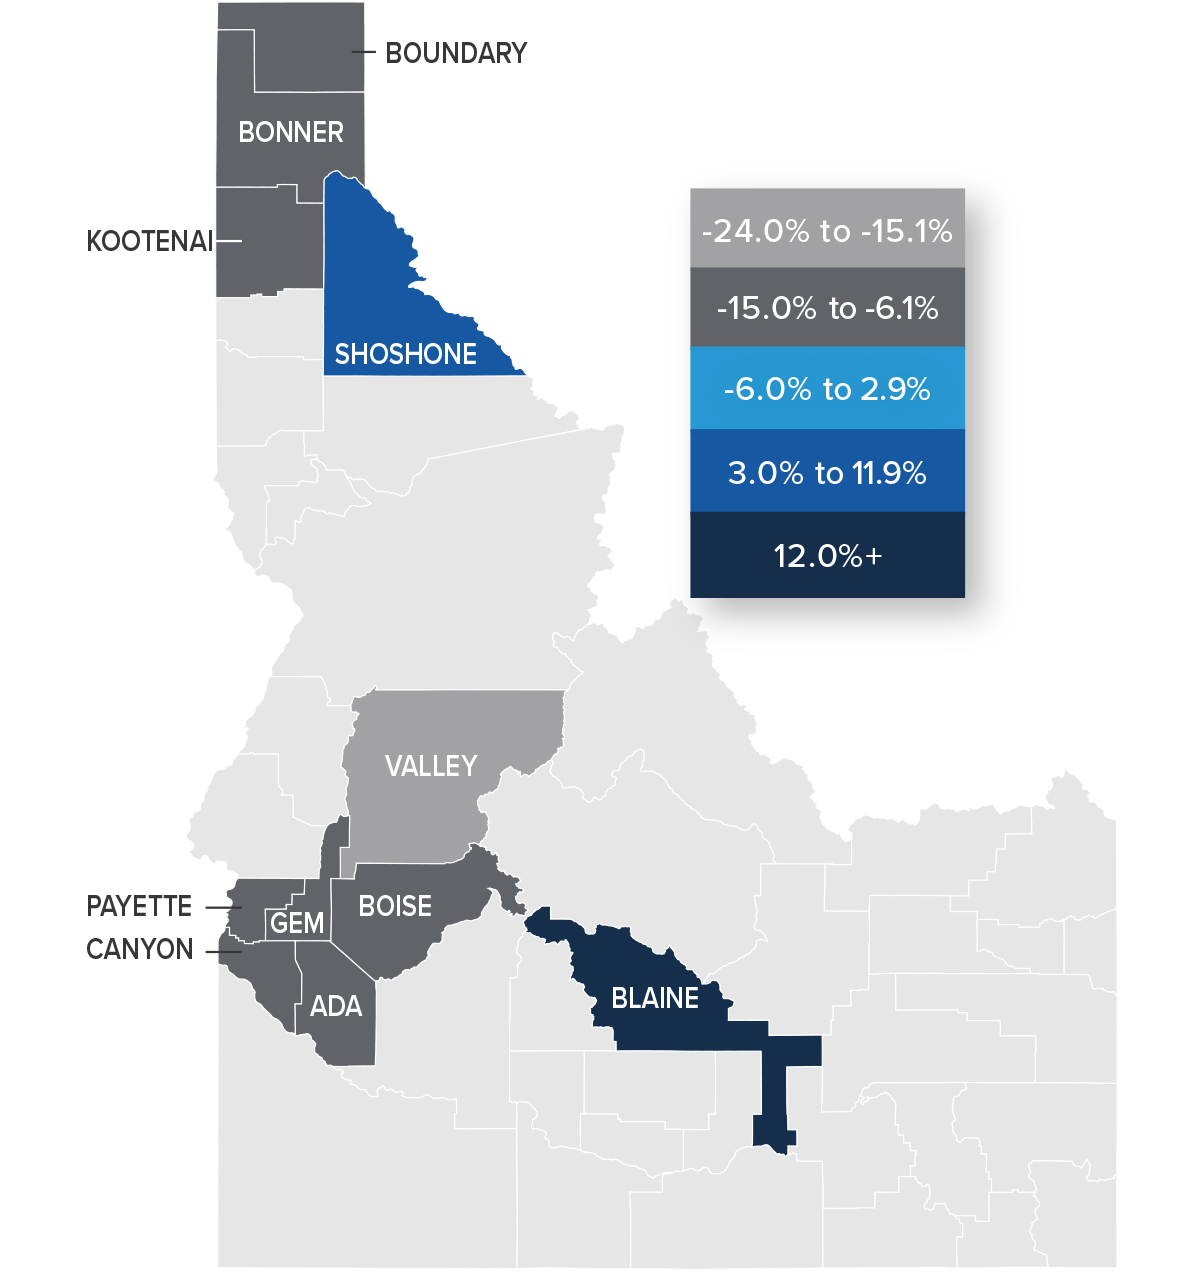
❱ Compared to the same period a year ago, sales fell in every market other than Boundary County, but this is a small market that can be prone to extreme swings. Compared to the first quarter of this year, sales rose in all markets other than Valley County, where they fell by a modest 2.1%.

❱ Pending sales were up 13% from the first quarter of the year, suggesting that sales may continue to rise in the upcoming quarter.

Annual Change in Home Sales by County / Q2 2022 to Q2 2023

Idaho Home Prices

❱ The average home price in the region fell 7.9% year over year to $605,535. Sale prices were 5.7% higher than in the first quarter of 2023.

❱ Compared to the first quarter of this year, home prices rose in all the Northern Idaho market areas and rose in every market other than Gem and Valley counties in Southern Idaho.

❱ Only one county in each of the northern and southern market areas saw prices rise year over year, while the balance of the region had lower sale prices. Prices fell 8% in the south and 7.6% in the north compared to the second quarter of 2022.

❱ Median list prices in the second quarter were down 2.9% from the first quarter. This may have contributed to the increase in sales and prices, as sellers are likely being more cognizant of the higher financing costs buyers are facing.

Annual Change in Home Sale Prices by County/ Q2 2022 to Q2 2023

Mortgage Rates

Although they were less erratic than the first quarter, mortgage rates unfortunately trended higher and ended the quarter above 7%. This was due to the short debt ceiling impasse, as well as several economic datasets that suggested the U.S. economy was not slowing at the speed required by the Federal Reserve.

While the June employment report showed fewer jobs created than earlier in the year, as well as downward revisions to prior gains, inflation has not sufficiently slowed. Until it does, rates cannot start to trend consistently lower. With the economy not slowing as fast as expected, I have adjusted my forecast: Rates will hold at current levels in third quarter and then start to trend lower through the fall. Although there are sure to be occasional spikes, my model now shows the 30-year fixed rate breaking below 6% next spring.

Idaho Days on Market

❱ The average time it took to sell a home in the region rose 27 days compared to the same quarter of 2022. It took an average of 20 fewer days to find a buyer than in the first quarter of this year.

❱ In all Northern and Southern Idaho counties, days on market rose compared to the same period in 2022. But compared to the first quarter of this year, market time fell in every county other than Valley.

❱ It took an average of 82 days to sell a home in Northern Idaho and 72 days in the southern counties covered by this report.

❱ Homes sold the fastest in Ada County in the southern part of the state and in Shoshone County in Northern Idaho.

Conclusions

This speedometer reflects the state of the region’s real estate market using housing inventory, price gains, home sales, interest rates, and larger economic factors.

The housing market performed well in the second quarter, even as mortgage rates rose. It will be interesting to see what impact the rate increases in June and July may have on sales activity in the third quarter. Though list prices have not fallen much, the share of homes on the market that have undergone price cuts has increased. This is likely in response to rising mortgage rates. Rising inventory levels favor buyers. If sellers are starting to acknowledge that buyers are being stretched given current mortgage rates, that too works in their favor. That said, higher sales activity and home prices, and lower days on the market all favor sellers